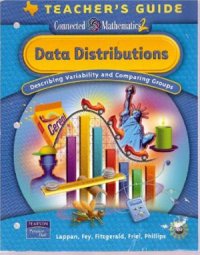
Ebook: Data Distributions, Describing Variability and Comparing Groups
Author: Lappan Ph.
- Genre: Economy
- Tags: Финансово-экономические дисциплины, Статистический анализ экономических данных
- Language: English
- pdf
Pearson/Prentice Hall, 2009. – 222 p. – ISBN: 0138900124, 0131656767, 0133662004, 9780138900120Maths - grade 7
Student activities reproducible for classroom use
This unit is a new unit for CMP II. It has four investigations that focus students’ attention on distributions of data, variability, measures of center, and comparing data sets.The big ideas of the unit are addressed in more detail in the Mathematics Background. Exploring statistics as a process of data investigation involves a set of four interrelated components:
Posing the question: formulating the key question(s) to explore and deciding what data to collect to address the question(s)
Collecting the data: deciding how to collect the data as well as actually collecting it
Analyzing the data: organizing, representing, summarizing, and describing the data and looking for patterns in the data
Interpreting the results: predicting, comparing, and identifying relationships and using the results from the analyses to make decisions about the original question(s).This dynamic process often involves moving back and forth among the four interconnected components—for example, collecting the data and, after some analysis, deciding to refine the question and gather additional data.Contents:
Describing Variability and Comparing Groups
Making Sense of Variability
Making Sense of Measures of Center
Comparing Distributions: Equal Numbers of Data Values
Comparing Distributions: Unequal Numbers of Data Values
Glossary
Appendix
Index
Acknowledgments
Download the book Data Distributions, Describing Variability and Comparing Groups for free or read online
Continue reading on any device:

Last viewed books
Related books
{related-news}
Comments (0)